Standard Deviation in Data Analysis
Standard deviation is a statistical measure that tells you how spread out the numbers are in a dataset. When you’re working with any kind of numerical information, whether you’re tracking performance metrics or trying to analyse your winnings on platforms such as https://onlinecasinovisa.nl/, understanding data spread becomes essential. Most people find standard deviation confusing at first, but it’s actually a straightforward concept once you break it down.
The basic idea is simple. Standard deviation shows whether your data points cluster tightly around the average or scatter widely. A small standard deviation means your numbers stay close to the mean. A large one indicates they’re all over the place.
Why Standard Deviation Matters
You can’t make informed choices without understanding your data’s variability. Standard deviation gives you context that a simple average can’t provide.
Imagine two students both averaging 85% on tests. Student A scores between 83-87% consistently. Student B swings from 70-100%. Same average, completely different stories. Standard deviation reveals this difference immediately.
This metric helps you spot unusual data points quickly. When something falls more than two standard deviations from the mean, it deserves attention.
Quality control departments use this principle daily. Manufacturing tolerances, customer satisfaction scores, and product defect rates all rely on standard deviation thresholds. It’s not just theory — it’s practical business intelligence.
How to Calculate Standard Deviation
The calculation follows a clear process. Here’s what you need to do:
- Find the mean of your dataset.
- Subtract the mean from each data point.
- Square each result.
- Calculate the average of those squared differences.
- Take the square root of that average.
That final number is your standard deviation. Sounds complicated? Most spreadsheet programs do this automatically with a simple formula.
Sample vs Population
You’ll encounter two types of standard deviation. Population standard deviation uses all available data points. Sample standard deviation estimates based on a subset.
For sample calculations, you divide by (n-1) instead of n. This small adjustment corrects for sampling bias. Which one should you use? That depends on whether you have complete data or you’re working with a sample.
Real-World Applications
Here are some examples of using the standard deviation in different fields:
| Industry | Application | Why It Matters |
| Finance | Risk assessment | Measures investment volatility |
| Healthcare | Treatment outcomes | Tracks patient response consistency |
| Education | Test scoring | Identifies learning gaps |
| Manufacturing | Quality control | Maintains product standards |
Financial Analysis
Investors rely heavily on standard deviation to measure risk. A stock with high standard deviation experiences dramatic price swings. Conservative investors typically avoid these. Risk-takers might embrace them for potential gains.
Portfolio managers use this data to balance investments. They combine high and low volatility assets to achieve desired risk levels.
Scientific Research
Researchers use standard deviation to determine if their findings are statistically significant. It helps separate meaningful results from random variation.
Clinical trials depend on this measurement. Drug effectiveness, side effect frequency, and treatment outcomes all get evaluated using standard deviation. Without it, we couldn’t trust medical research conclusions.
Interpreting Your Results
Understanding the numbers is one thing. Knowing what they mean is another.
A standard deviation of zero means all values are identical. That rarely happens with real data. As the number increases, your data becomes more dispersed. But what counts as “high” or “low” varies by context.
In some fields, even small variations matter. In others, wide spreads are normal and expected.
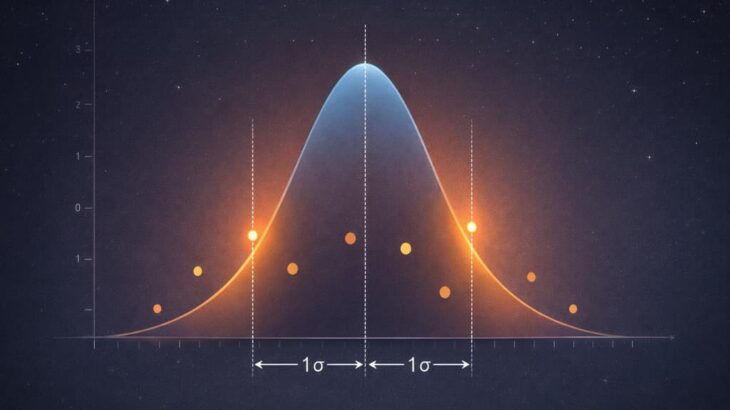
Normal distributions follow a predictable pattern. About 68% of the data falls within one standard deviation of the mean. Around 95% sits within two standard deviations. Nearly all data (99.7%) stays within three.
This rule helps you quickly assess where individual data points stand. Is a value unusual or perfectly normal? Standard deviation tells you.
Common Mistakes to Avoid
People often misuse or misinterpret standard deviation. Watch out for these errors.
Don’t compare standard deviations across datasets with different scales. A standard deviation of 5 means something different for test scores (0-100) versus temperatures (-20 to 40).
Never ignore the distribution shape. The 68-95-99.7 rule only works for normal distributions. Skewed data requires different interpretation approaches.
Tools and Software Options
You don’t need to calculate standard deviation by hand anymore. Modern tools handle the math instantly.
Excel uses =STDEV.S for samples and =STDEV.P for populations. Google Sheets offers the same functions. Statistical software like SPSS, R, and Python’s NumPy library provide even more sophisticated options.
Which tool should you choose? Start with what you already know. Excel works fine for most basic analyses.
Moving Forward with Data Analysis
Standard deviation forms the foundation of statistical thinking. Once you grasp this concept, more advanced techniques become accessible.

You’ll start noticing patterns others miss. Data that seemed meaningless suddenly tells a story. Decisions that felt like guesswork become evidence-based choices.
Start small. Calculate the standard deviation for a simple dataset you care about. Maybe it’s your monthly expenses, workout times, or daily step counts. The practice builds intuition that spreadsheets and formulas alone can’t teach.